
If all you saw was the image above along with the title – Billboard’s “Hot Rap Songs” Chart (1989-2015) – you’d have no idea what’s waiting at the other end of the link. Hit it and you’ll find that Matthew Daniels at Polygraph has created what may be the best infographic about music ever.
Even if you don’t like hip-hop, you should check this out. It’s that good.
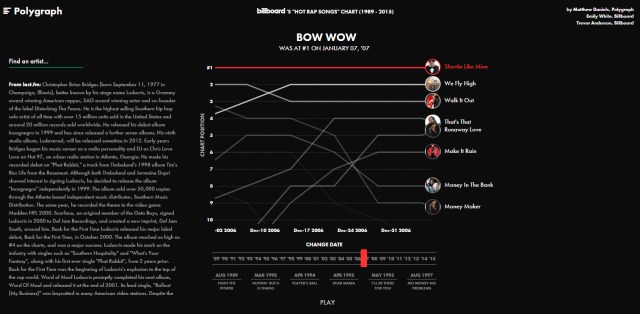
The heart of the infographic is a side scrolling chart that automatically rolls from 1989 to 2015. The chart logs songs that peaked in the top 5 each week and follows their positions in the top 10 as long as they stayed on Billboard’s chart.
As the chart scrolls through each week you listen to a sample from the song that was #1 for the week. The longer the song stayed at #1, the more of it you hear. The end result is a mix of of #1 hip-hop hits covering 26 years. The only break in the music (and the only weakness of the infographic) is that there’s no sound for some songs.
A slider on the bottom of the chart lets you start the roll anywhere you like. Mouseing over the little artist circles that are moving up and down as the artist’s hits move up and down the chart brings up the artist’s entry on last.fm to the left of the chart. Click on the artist circle and you can listen to the song instead of the constantly changing mix of #1 songs.
If you know this music, the chart’s a trip down memory lane that could easily eat up the rest of your day. If you aren’t familiar with hip-hop, it’s hard to imagine a better introduction. And if your ears are so closed that you won’t even listen to hip-hop, don’t despair. Daniels says he’s working on doing the same thing for other musical genres.
Why are you still reading this? Click the link.


Pingback: Hip Hop Then to Now | Passion and Beats