
In recent years the population of the United States has increased by approximately 0.7% each year. Which areas of the United States experience this growth? Where does a local increase in population come from? Do the number of births outweigh the number of deaths? Do people move into the area? If people move in, do they come from inside or outside the United States?
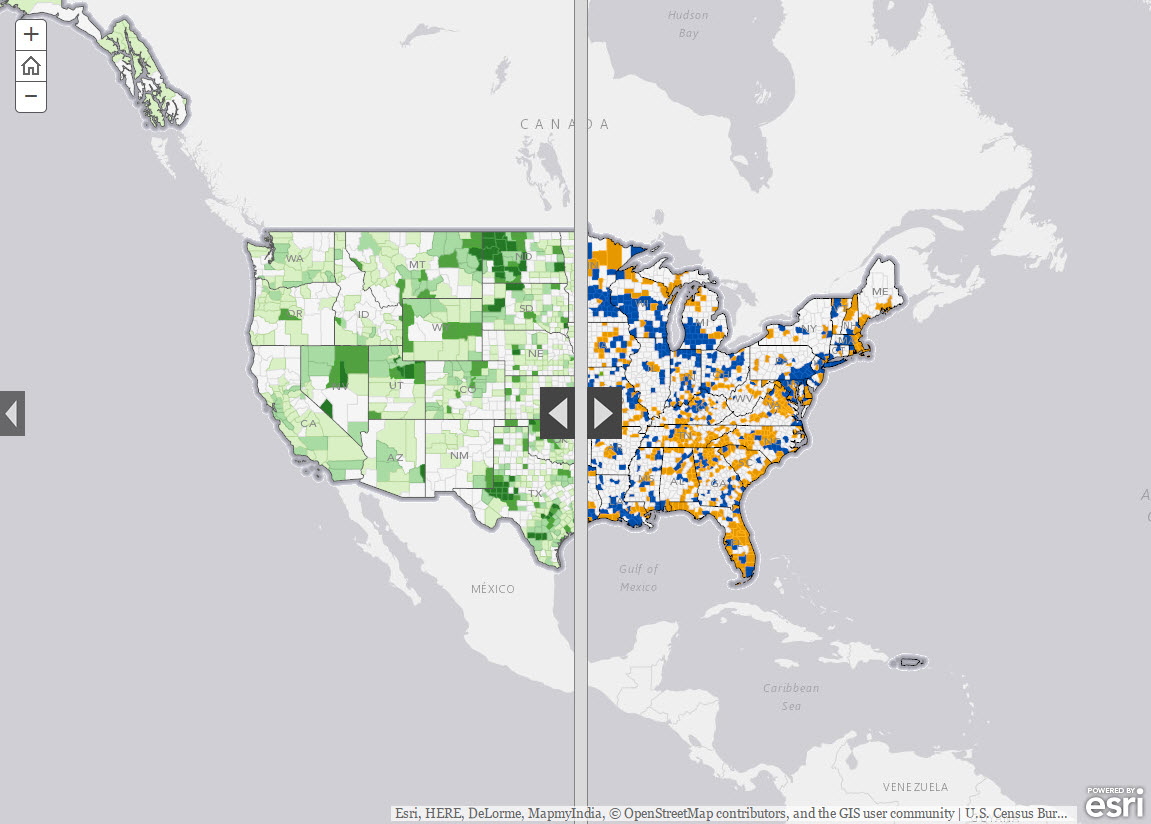
The US Census Bureau has built an interactive map that can answer these questions for every county in the US for the year 2012. The map is composed of two layers that are separated by a slider. The map can be zoomed with the mousewheel and moved by dragging while holding down the left mouse button.
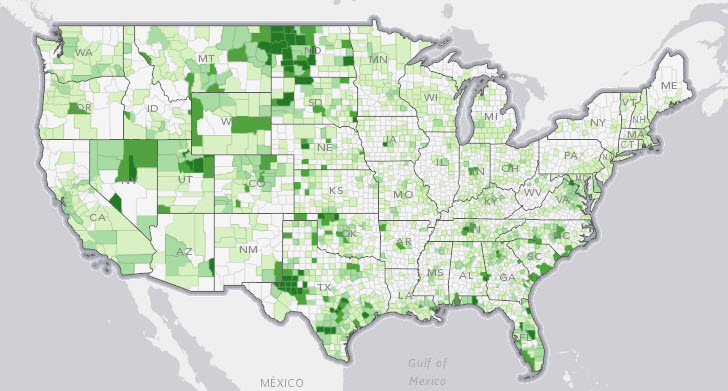
One of the layers in the map shows which counties experienced population growth during 2012. The percent increase is shown by different shades of green in the image above. Clicking on a county brings up a box that shows the county population at the end of 2012 along with the percent increase in growth. The box also gives the number of births and deaths in the county along with the net change in population due to natural causes (i.e., number of births – number of deaths). Finally the net migration into or out of the county is shown. Net migration is further broken down into net migration from domestic or international locations.
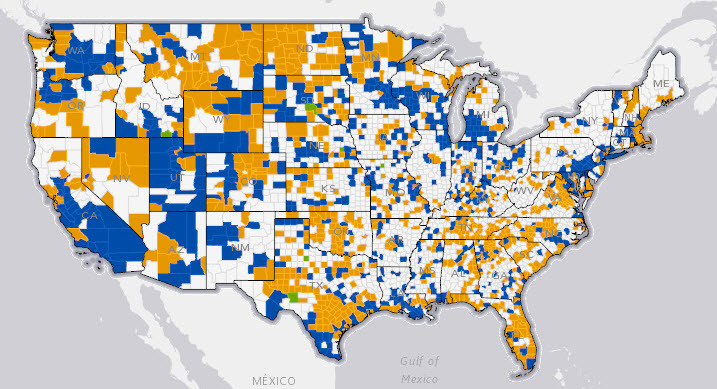
The other layer focuses on the sources of population growth. Counties where population increase was due mainly to migration are shown in orange, counties where the increase was caused mainly by births outnumbering deaths are shown in blue, and counties where the increase was caused equally by migration and natural causes are shown in green. Clicking on a county pops up a box that gives the same information about net changes due to natural causes and migration detailed in the preceding paragraph.
There is a good deal of interesting information in these maps. For example, the core areas of some large cities seem to be attracting outsiders while the core areas of others are not. Both Los Angeles County and Manhattan have increased in population due to natural causes primarily because the number of people moving out of these counties is greater than the number of people moving in. San Francisco County and King’s County Washington (Seattle’s home county) increased in population from both natural causes and from people moving in.
 Unfortunately you cannot tell whether the information gleaned from these maps is indicative of a pattern or is something peculiar to the year 2012. It would be helpful if the Census Bureau would provide a map like this for every year for which they have the data. It would be even more helpful if the maps were fed by a database so the user could enter a beginning and an ending year and see how population changed over the time period they specified.


Pingback: Population Movement Within the United States | THE INFO MONKEY