About a month ago The Info Monkey took a look at the sources of population growth in the United States in 2012 with the aid of an interactive map developed by the US Census Bureau. Recently the New York Times took a different look at population change in the US with a collection of interactive area charts that track population movement into and out of every state in the US as well as the District of Columbia from 1900 to 2012.
Movement into and out of each state is shown on separate charts with a toggle to switch back and forth between the two. Regions – West, Midwest, South and Northeast – are shown with color-coded bands. For movement out of a state, the bands in each chart show the proportions of people who remained in the state, moved to one of the four regions, or, if the proportions are large enough, moved to other states. The charts for movement into a state give similar information and add the proportion of the state’s population that was born outside of the US and then moved into the state. Mousing over the charts produces a pop-up that gives the numerical proportion for each of the bands shown in the chart at 10-year intervals.

Virginia

South Carolina
Every state has intriguing or interesting stories to tell. For example, compare emigration from Virginia and South Carolina, two of the states most strongly associated with the South in the American Civil War. In 1900, 35 years after the Civil War ended, 13% of the people born in Confederate Virginia had moved to states in the Union Northeast while only 7% had moved deeper into the South. This is in direct contrast to South Carolina where less than 2% of the people born in the state had moved to the Northeast while 15% moved to other states in the South. Why were Virginians more willing to move to the hated North than their compatriots from South Carolina?
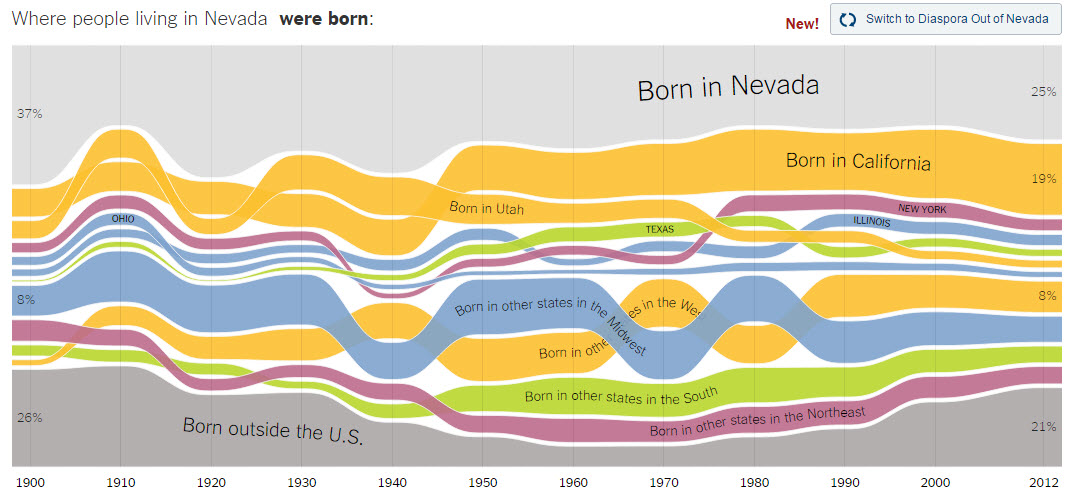
Here’s another example. Which state had the lowest proportion of residents who were born in the state in 2012? Florida, which is widely seen as a destination for retirees from the Northeast and Midwest, is up there with only 36% of the 2012 population born in the state. The clear winner, however, is Nevada with only 25% of the state’s resident’s born in Nevada. The native-born Nevadans are swamped by residents who were either born in California or outside the US. Together these two groups made up 40% of the population of Nevada in 2012.

Given current fears about immigration it’s interesting to look at the proportion of people in each state who were born outside the US. Most states had higher proportions of immigrants in the early 1900s than they do today. This is even true of Arizona, a hotbed of anti-immigrant sentiment. From 1900 to 1920 approximately 25% of the state’s population was born outside the US. From 2000 to 2012 that proportion had shrunk to approximately 15%. The exceptions are Texas, Florida and most of the South which have higher proportions of immigrants living in-state today than they did in the early 1900s.
These population movement charts from the New York Times are an excellent example of how the current interest in data visualization can display information in a useful and easily understood manner. Time-sink warning: If you are a curious person, it’s easy to get lost in these charts wondering about the causes and consequences of the movement patterns that the charts so clearly illustrate.