Sometimes amazing things happen when you give people tools and let them loose. On Broadway, “a visually rich image-centric interface” is a good example. What’s a visually rich image-centric interface? It could be a lot of things. In this case it’s something like a data and image-loaded walk from one end of New York City’s Broadway to the other.
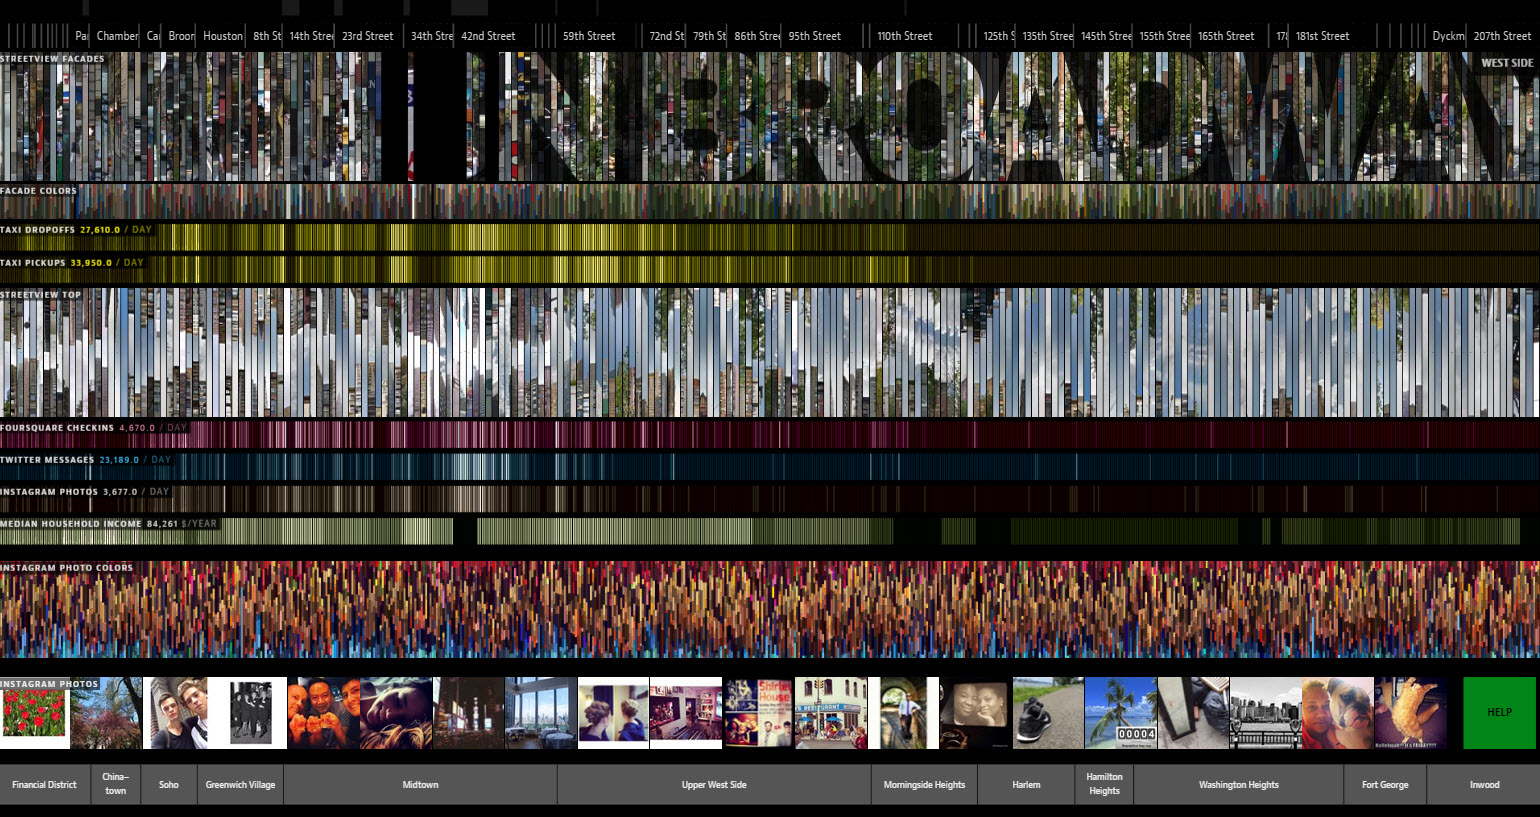
On Broadway stacks 13 data panels on a horizontal line that moves from the south end of Broadway on the left to the north end on the right. Reading from the top, the 13 panels show the following.
 Landmarks and cross streets to tell you where you are
Google Street-View facades
Colors from the Street-View facades
Average number of taxi drop-offs per day
Average number of taxi pick-ups per day
Google Street-View overheads looking straight up
Average number of Foursquare check-ins per day
Average number of Twitter messages per day
Average number of Instagram photos taken per day
Median household income per year
Colors from Instagram photos
A selection of Instagram photos
The Manhattan neighborhood you’re in
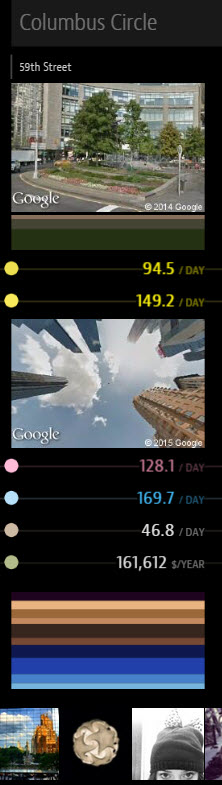
The information in each panel is compiled from data gathered every 30 meters along Broadway’s 13.5 mile length. You can click-and-drag with the left mouse button to scroll-stroll along Broadway and use the mouse wheel to expand a panel such as the one from Columbus Circle on 59th Street that is shown on the left.
The data compiled in On Broadway are not drawn from the same time periods although all of it is recent. The taxi data are based on 22 million trips taken in 2013. The Foursquare data are based on a bit more than 8.5 million check-ins from 2009 t0 2014. The Twitter data is from all publicly shared tweets with images between February 26 and August 3, 2014. The Instagram data is from all publicly shared photos from the same time period as the Twitter data. There are 713 individual panels and 661,809 Instagram photos in On Broadway.
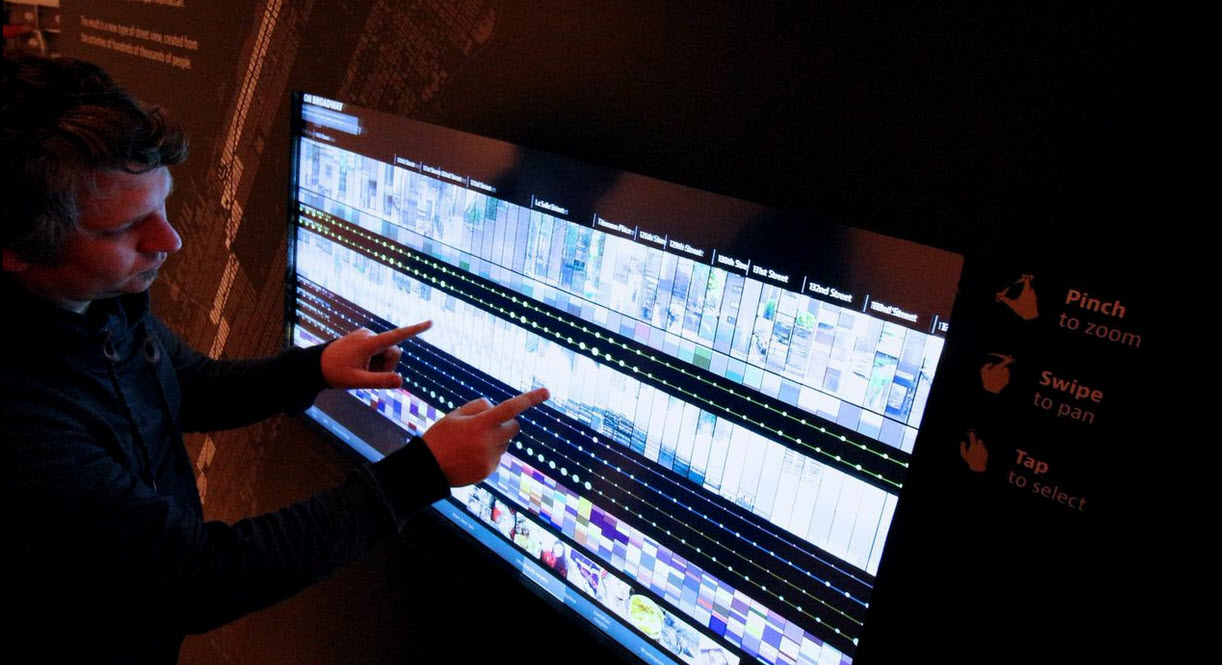
On Broadway is an interactive installation which is on display at the Public Eye Exhibition at the New York Public Library until January 3, 1916. The New York Public Library is located about a block east of Broadway between 40th and 42 Streets. If you’re in the area, check it out. If you’re not in the area, you can check out the web version. There’s a lot of data in On Broadway so loading the app in your browser may take some time if you have a slow internet connection.